
In a typical team, data models get written on top of a certain set of data sources to answer a particular number of those business questions. But… then a new stakeholder comes along with a new set of questions, possibly requiring a new data source to be integrated. The data model expands… and expands…. and expands…
Until the end-result is that organically grown model that is incredibly hard to maintain, and very difficult to understand for a new member to the team.
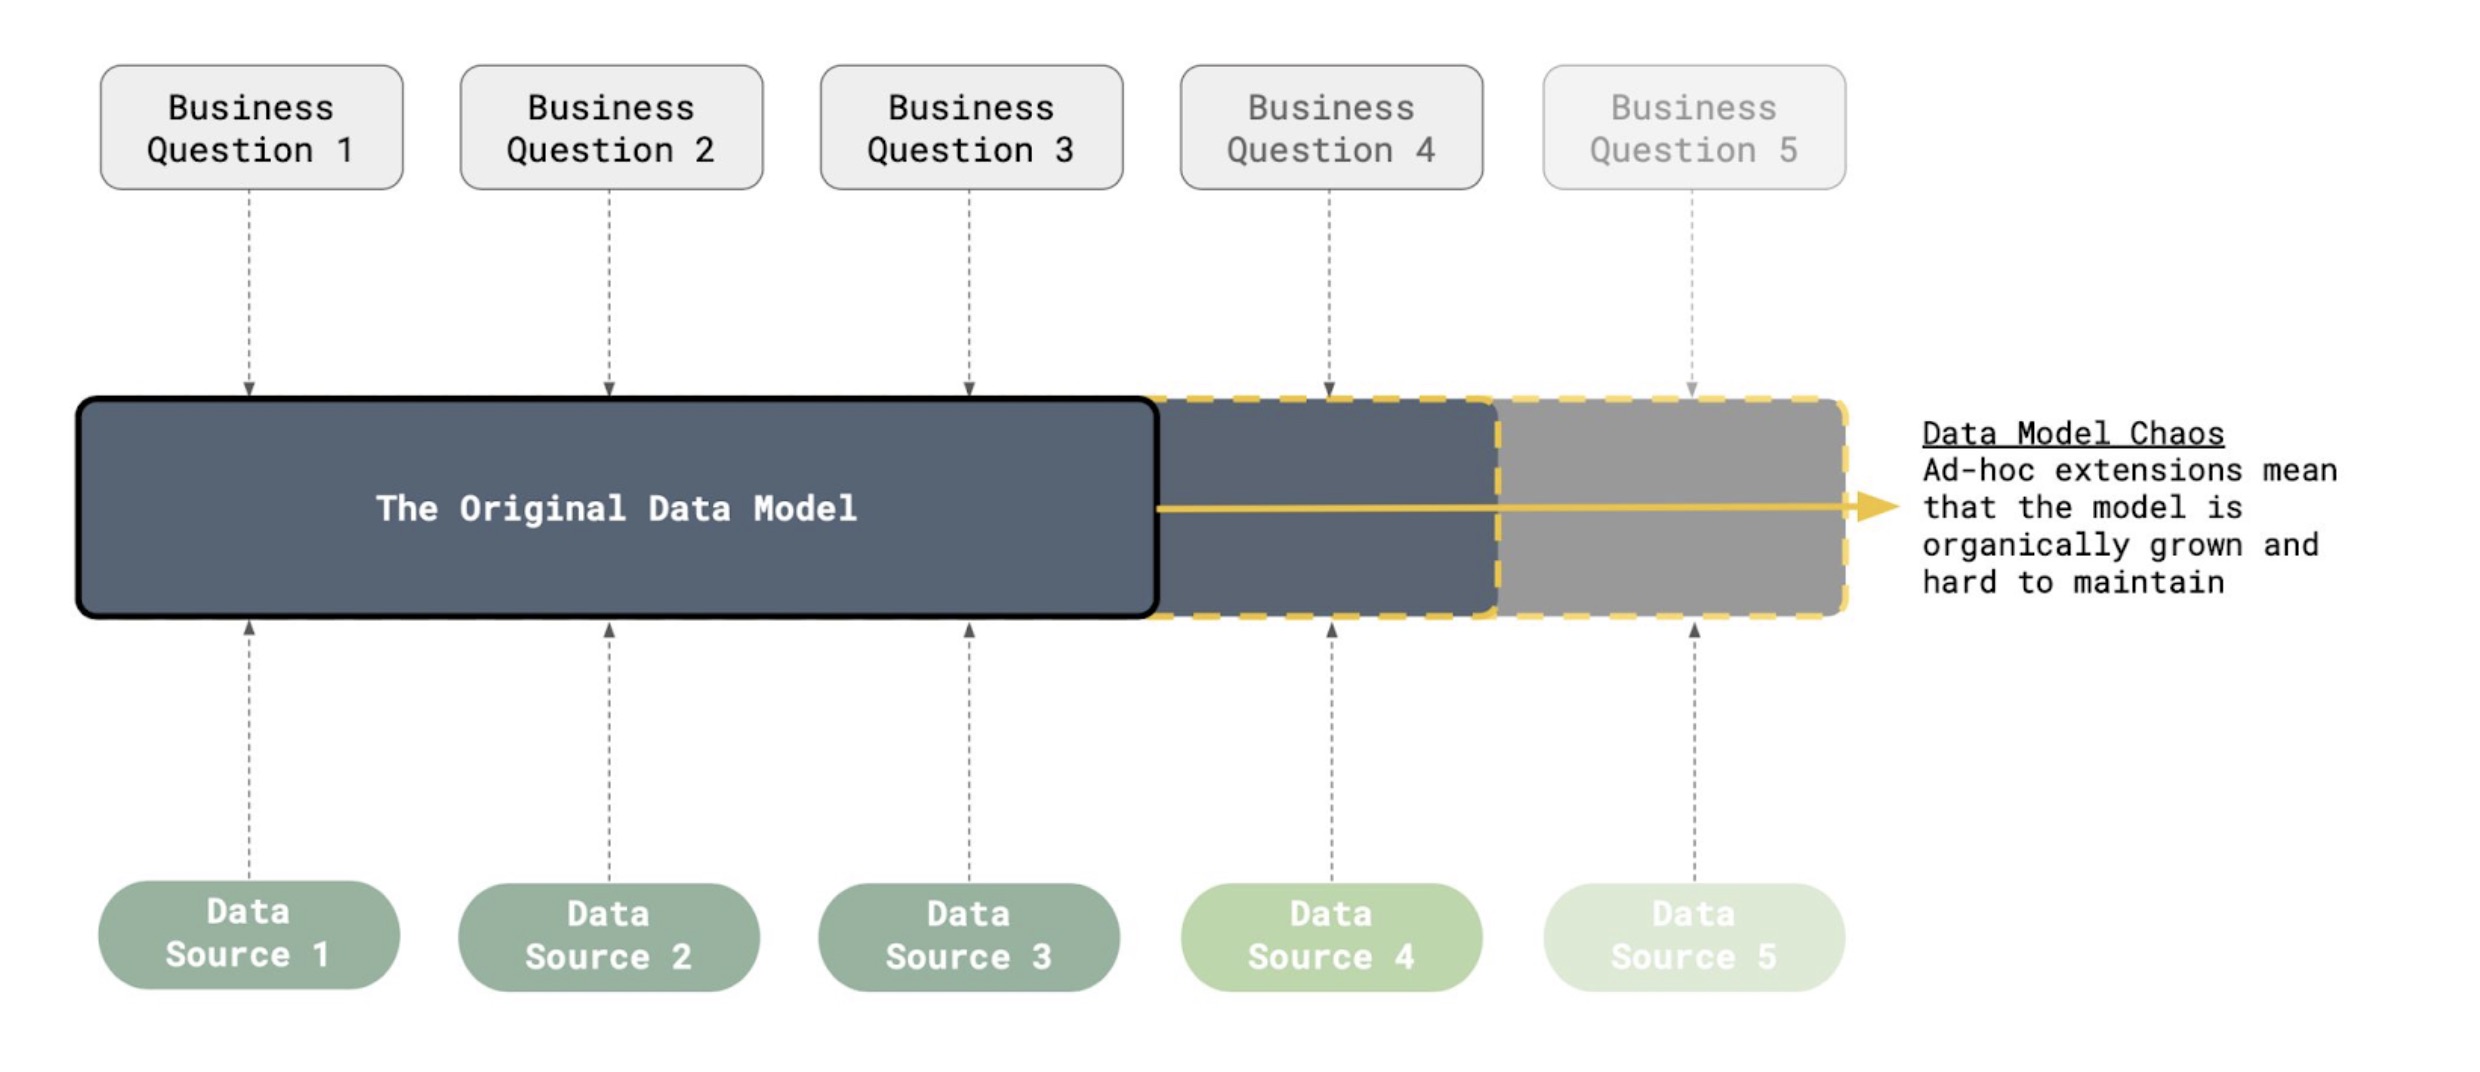
These models are especially risky as they practically always lead to inconsistencies, inaccuracies, and different sources of truth. So, what if we told you it doesn’t have to be like this?
Let’s look at the problem again. The questions we are trying to answer might be dynamic, but they are all about something that is a lot more static in structure — the business itself.
And that is no surprise: we find that, after establishing some form of product-market fit, the structure (the way they can be described in a business model) of most businesses will stabilise. Sure — new geo’s might be added or new acquisition channels opened, but a mobile subscription app will stay a mobile subscription app. That means there always exists a layer of ‘abstraction’ that we can describe with the data model — a static target. We call this layer of abstraction the Domain Model.
As most of the ‘modern data stack’ revolutions, it has its origins in software engineering circles (we’re sure a lot of you can remember object oriented programming classes at university, and Bill Inmon did a lot of work translating this to classic database structures). For us it has taken the place of the more classic Kimball or Snowflake modelling approaches.
How does this work?
The important bit of a domain model is that it describes all the entities in the business and defines their underlying relationships. For instance, for company Tasman, what is a client? What are the necessary minimum criteria to describe a client? What is a Sprint? How do clients interact with Sprints? It also stipulates the type of relationships: one Client can have multiple Sprints (at least one), but one Sprint can only have one Client.
Note that all this is done without looking at data sources — the domain model is a theoretical exercise perfectly modelling the business, and only later fills in the defined entities with the available data.
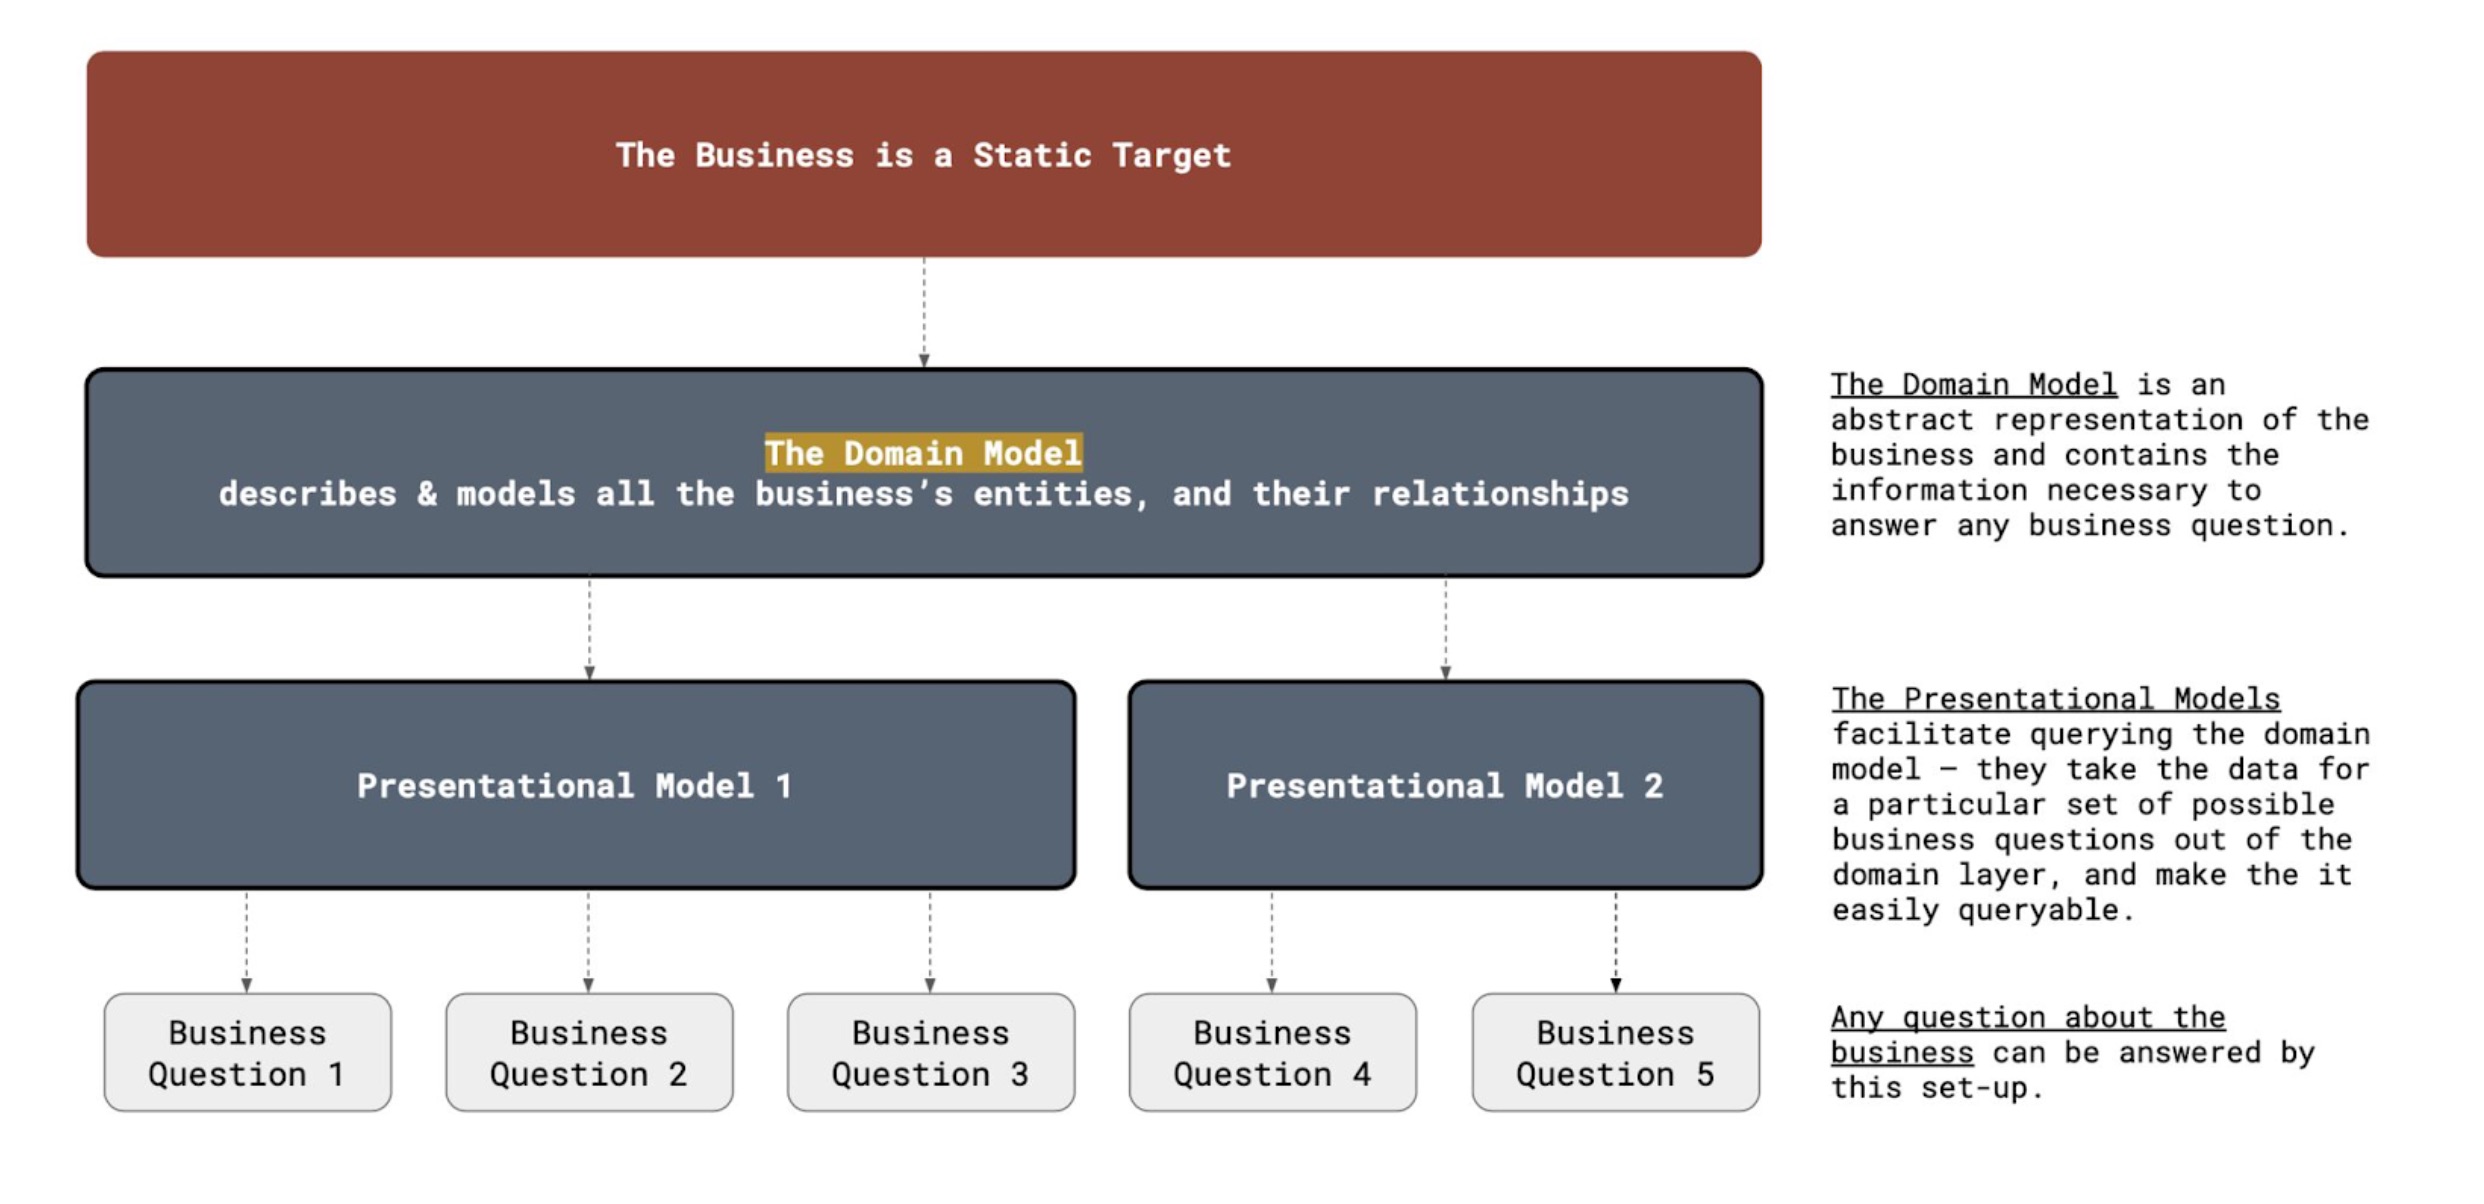
In a typical data stack we build, the domain model is reflected in a ‘domain layer’ that structures the available source data into that perfect representation of the business. That static target is then the only data source for any downstream data consumption — whether that be additional models (which we call presentational models) or direct consumption of domain layer data by a deep piece of analysis.
This guarantees:
- A single source of truth — the domain model has defined all the core business logic and can answer any question possible about the business;
- A static target — if you swap out a SaaS tool, you just need to make sure the domain layer imports the new data source correctly. No need to rebuild every dashboard;
- And a separation of concerns in the stack. So much easier to maintain!
How do we build it?
So, there is clearly a need for a Domain Model in building scalable data ecosystems. But how does it work in practice?
Remember that to build the domainbusiness model, no data is involved — the whole point is that we build a reference model first, and only then fill it up with data. In the image attached you’ll see an example of this, based on real client work we do.
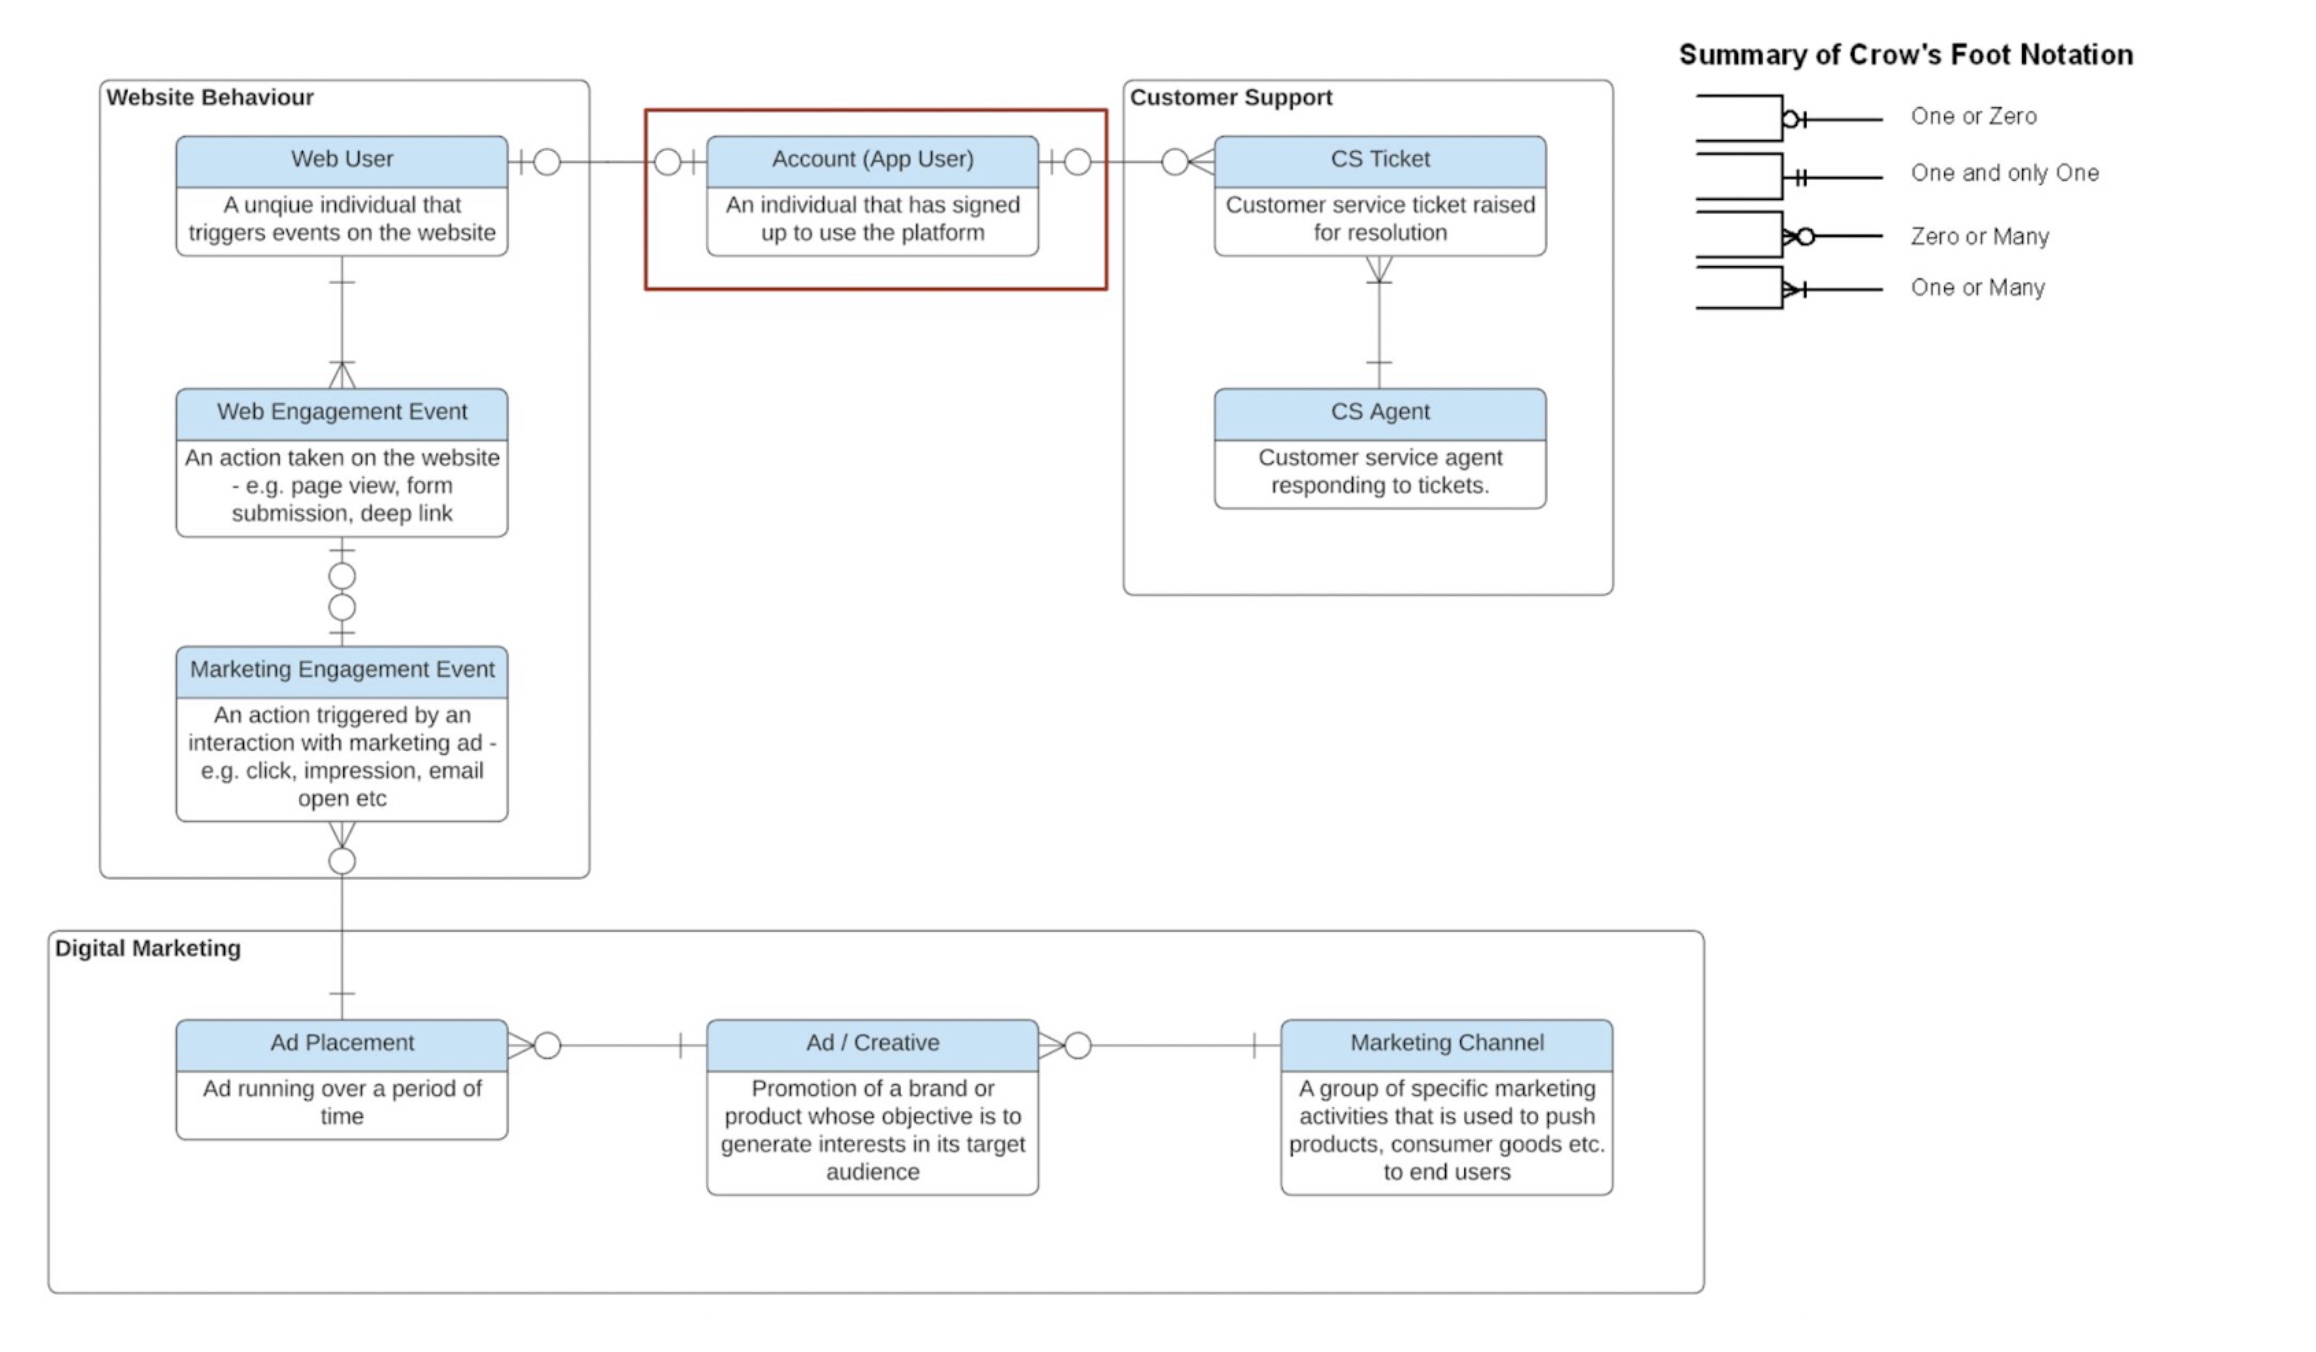
This particular model is a very typical flow. Imagine a website that acquires users from marketing campaigns, draws them to the website, has them sign up and then allows users to engage with customer support. Forget for the moment about transactions and financials — we removed them to simplify the model. This flow then describes absolutely all we need to know about the entities in the business, and how they interact:
- The Account user is the central entity, and the most important for the business. The model enforces a very clear definition: this is a user that has signed up to use the platform.
- It is therefore different from the Web user: that is any unique individual triggering engagement events on the website. There is already a very important learning here: some pieces of user analysis might need a Web user definition, others an Account user — different beasts altogether! This will become critical in analysis data later.
- And as you can see, the Account user doesn’t even necessarily have to be linked to a Web user.
- A web user should have one or more web engagement events as that is how they are defined.
- The web engagement events could be generated by a marketing campaign but don’t have to — this is where we allow for direct traffic to the website.
- And, on the other side of the flow, the Account User can (but doesn’t have to) interact with a Customer Support ticket. A Customer Support ticket always needs to be linked to an Agent.
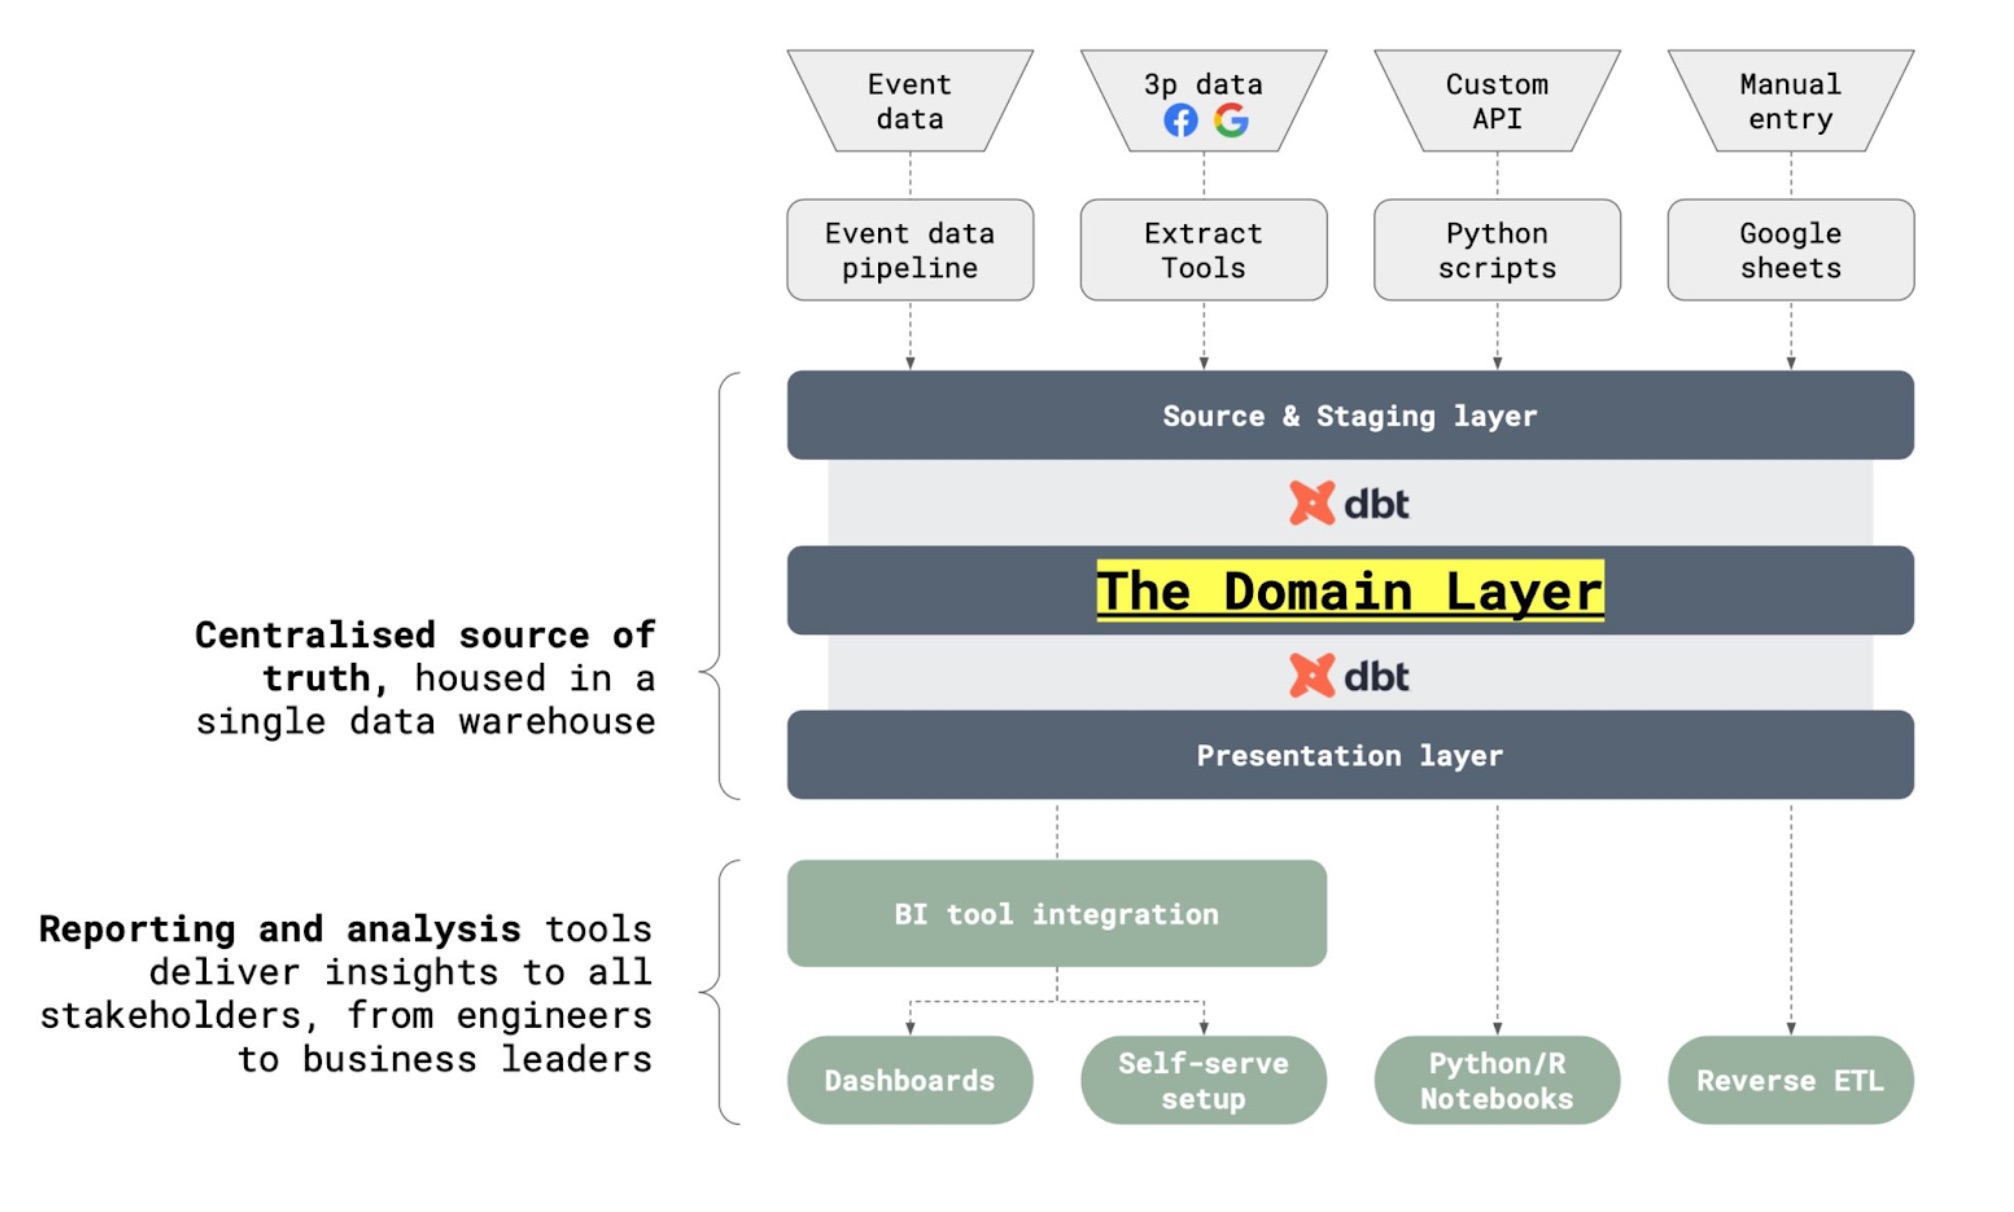
We call the representation of the domain model in the data warehouse the domain layer — it populates the entities defined in the domain model with data points that we retrieve from the source & staging layer (see second illustration for how this fits together). To populate the Account User for instance, we might have to retrieve data from Hubspot, Rudderstack, backend or any other available source.
So, this is how the static target part we talked about last week works: all that matters for downstream data consumers is that they can query the Account User table. They do not have to think about the actual data sources for that table, and have a very clear definition they can rely on to build the entire company data ecosystem on top of.
Presentational Layers
The Domain Model also regulates how the entities interact, and therefore how they need to be joined together to form meaningful answers to business questions. But how do we use it to uncover actual insight? How do BI tools consume it?
There are a few very important principles here, following a classic “separation of concerns” pattern:
- Downstream consumers of data can only query data that is exclusively built in the domain layer (so no direct consumption of source data);
- All business logic modelling is done in the domain layer, not before and not after (so that we can maintain that logic in as central and generalisable a place as possible);
- We want to avoid measure definitions or complex join structures done by the data consumers (so that we do not build a dependency on their often insufficient data modelling environments);
- But at the same time, as most data-consuming tools prefer nicely structured tabular data we find that the Domain Layer is too general to be effective — and so, an intermediary step is required before data is ready to be visualised.
We call this final stage the “presentation layer”. You can see it on the illustration above as sitting between the Domain Layer and the data consumers. They are essentially pre-built, use-case specific joins of the Domain Layer entities to answer particular business questions in a fast, easy, version-controlled way.
That means that we build presentational models quite tailored to the output — especially for BI. It will be designed for a specific BI tool (e.g. Looker) and for a specific use case (e.g. an insight into retention). Often they’re also pre-aggregated to increase efficiency of the models. It contains the metrics and KPI definitions that are necessary to deliver the use case (e.g. aggregation of activity to define retention).
For a recent project in an EdTech company, we had to model retention on different time periods for subscription seats. The business sells subscription plans to schools and needed to know how well the product was used.
For the domain model in dmn_teachers (we label our tables according to the layer they are in) we had all our complex school mapping logic, we held whether or not a teacher held a seat. We had a license model that determined the seat type of each teacher at each point in time and how that changed.
We then had a presentation model for growth called prs_growth — this kept all our logic around how many monthly renewals there were, MRR definitions, ARR definitions, seat counts per organisation. Another prs model then held the data for all the prs_monthly_active_users — users who had completed one of a certain type of events. This brings together data from different models, teachers, licenses, events, budget to display one model on active users.
Conclusion
Data model creep is a real problem faced by almost every fast-growing business with a data team. There are different ways of solving this problem — but all will require some level of abstraction between the available data and the objects of the business that you are trying to describe well. Putting that modelling of the business front and centre in our architectural designs has worked very well for us; and we recommend you give it a try!