The Holistics framework prioritises reusability and collaboration. Through its data models, datasets, and Git integration, teams can build consistent, scalable, and accurate BI solutions. With its dashboard or canvas interface and embedded analytical options, such as period-over-period, the final visualisations are quicker to customise to a wide variety of end user desires.
It’s a great time to be in the market for a BI tool – so much choice, and so much (good!) competition. But making a multi-year choice that’s quite foundational for your team can be overwhelming. There are dozens of different BI tools on the market that start to look similar after a while.
It also becomes difficult to get a grasp of how good the tool really is. There’s no one size fits all option, as your individual data, requirements and experience affect the tool of choice. At Tasman we have done the hard yards of trying out several of these options with real world applications and help identify the right tool for the right job.
One of our favourites is Holistics and I’d love to tell you a bit more about it – the tl;dr is this:
- The developers love it for it’s Semantic layer;
- The analysts love it for it’s Analytics as code;
- The end use loves it for it’s customisable dashboard vs canvas approach;
- The finance team love it for it’s cost-effective and transparent pricing.
Let’s unpack the details as to why these add up to being one of our frequent tools of choice.
Structure of the Semantic layer
The development structure of Holistics is represented by the following diagram, going into further detail below.
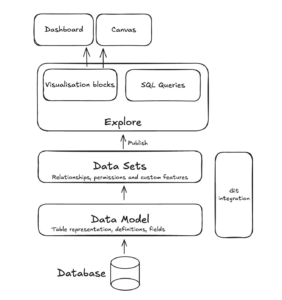
Database visibility
Holistics SQL Editor, has a direct 1:1 representation of the raw tables in the connected database allow for querying and exploring of the original data warehouse. This is particularly useful to identify raw data and troubleshoot all from the same tool, especially with several data sources.
Data models (The semantic layer)
Create reusable models, from a table or query, that refer to the underlying raw data. This is where we define dimensions (used for filtering or categorisation) and measures (metrics like total revenue or average customer spend).
Holistics is displays versatility in their aggregations. You have the option to code these calculations in the data model, or just as easily create it from the dimension in the final explore.
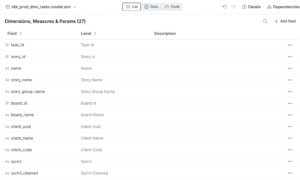
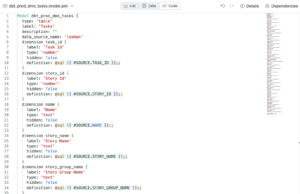
These reusable models can be interacted with in a list format as seen above, or if you prefer to codify the structure, by using their own developed code AML.
Reproducibility of Analytics as code
There’s not much out there than can codify models and queries that is both robust and concise. Existing languages such as Python or JSON are either overly complex or lack specificity for the use case. Looker’s LookML does a good job of meeting this balance, but it is proprietary. The team at Holistics has come up with their very own to meet this need for reproducing logic across the platform, called AML (Analytical Modeling Language) and AQL (Analytical Querying Language).
The data models and datasets are all version controlled with Git. This is particularly useful for larger teams where several dev branches can be worked on at a time with any troubleshooting or reverting abilities available.
Datasets
As the name suggests, it is a set, or collection of data models that could be explored together.
Within the dataset, you’re able to design how you wish to interact with the data.
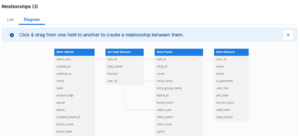
Most importantly, you define the relationships and joins that exist between the previously defined data models. This ensures accuracy and consistency of business logic across analyses.
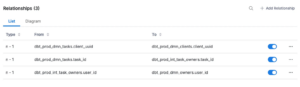
What should be apparent by now with Holistics is the provision of options. This is similarly the case with relationship building. You can set these relationships graphically or rule by rule.
The datasets are also the place where permissions can be set or more complex cross-model dimensions and aggregations can be defined once and used multiple times.
To ensure the datasets are as easily self serve as possible, they can be grouped into themes, such as “Marketing” to ensure that the marketing team will find all the datasets that they may want to explore in one place.
Exploratory layer
Prior to finalising the desired report or visualisation, you are easily able to explore a datasets with an intuitive drag and drop interface. Alternatively, SQL based exploration is also possible. This ensures the data is self serve for all technical abilities within a business.
Within the exploratory layer, you are able to define specific dimensions or measures for the once off use case that does not have to be seen by all. Should this new dimension be required, you are able to promote it to the semantic layer to be defined once and used company wide.
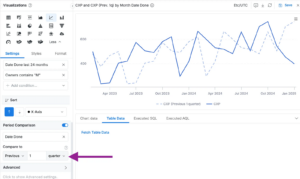
A unique selling point of Holistics to some of the alternative BI tools, is the ease at which one can create a period-over-period comparison at the click of a button; or change ones date granularity within the same dimension.
The exploratory layer is the starting point for any visualisations. With a wide array of graphics to choose from.
End user flexibility
Often tools’ benefits favour either the developer or the business user, here there are strong benefits for both. For the business users the experienced interface is customisable. My personal favourite of these is the option for the recently released canvas approach to visualisation.
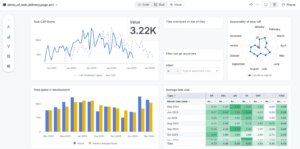
This is a great solution for a team where there’s a more organic flow to their insights, whether it be a customised tool that requires filter controls placed near the visualisation, graphs within graphs or a metric tree for the entire company (sign up to our newsletter for seeing more on this soon).
No doubt, the traditional dashboard is still available and our most frequently used approach. There will likely always be a desire for the structure and clear curated page of insights all in one view. Holistics still does well here in allowing the designer greater choice of sizing and positioning of their tiles.
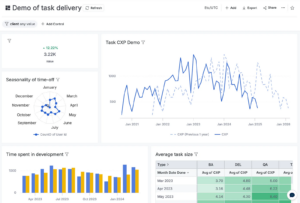
The option to have free reign with the structure of the visualisations and insights ensures the end users can use it in a way than works for them.
Financial sweet spot
At the price point of Holistics, the finance team would agree on its value for money. It is at the lower end of the cost bracket of BI tools, which is particularly enticing when considering how close it is to the functionality of the more expensive tools available.
It’s transparent pricing – no need to be in the sales funnel in order to receive an idea of how much it will cost.