News & Views
Satellites on Fire – Counting Fires is not the Same as Measuring Them
670,940 satellite heat detections in Argentina across 11 years. The detection count peaks in August. The fire damage peaks in January. They’re measuring different things, and confusing them hides where the real destruction sits.
Table of content
Why we are interested in this
Tasman has been working with The Earthshot Prize, a global environmental award founded by Prince William, on leveraging their data across multiple projects for over three years. So when the 2026 finalists were announced, Satellites on Fire immediately caught our attention. We suspected the most visible metric was hiding the real picture. And since the Argentinian startup is building faster fire detection on top of open satellite data that are publicly accessible, we decided to investigate further.
This is the first of a series of analysis pieces exploring the work of Earthshot Prize finalists. The ceremony is 17 November in Mumbai. Over the coming weeks we’ll be publishing more on the solutions and organisations the Prize exists to celebrate. You can find all the published pieces here.
Every country has a fire season, but they don’t overlap
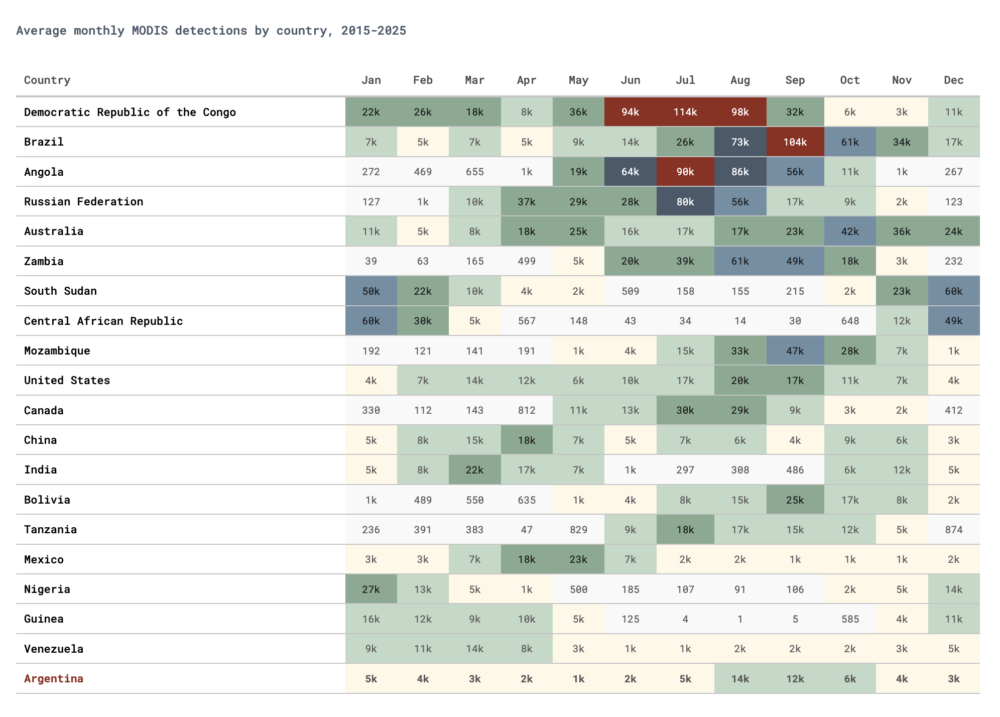
Starting with the helicopter view, fire detection follows hemisphere and rainfall. Sub-Saharan Africa dominates global counts May through September. South America lights up August through November. Whereas Australia and Russia each have their own windows of peak fire detection.
Zooming into Argentina
Argentina is ranked 20th globally by detection count, but the fire detection count alone is not enough to give the full picture. It is hiding important insights.
The chart that misled us
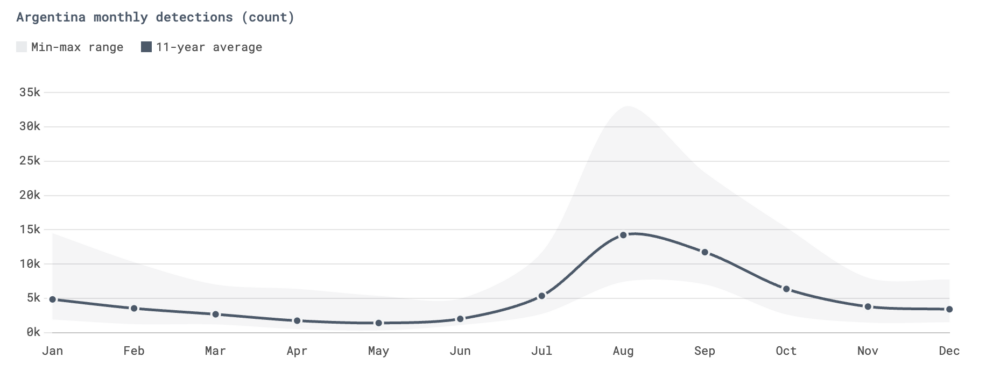
If you plot monthly detection counts for Argentina, August or September wins almost every time. August is the peak in 7 of 11 years, September in another 3. And the average is 14,218 detections in August, nearly triple of what you can observe in January, which is 4,839 detections. A count-based analysis paints the picture that Argentina has a late-winter fire problem.
That’s wrong. Or rather, it’s answering the wrong question.
Argentina has three distinct fire regions
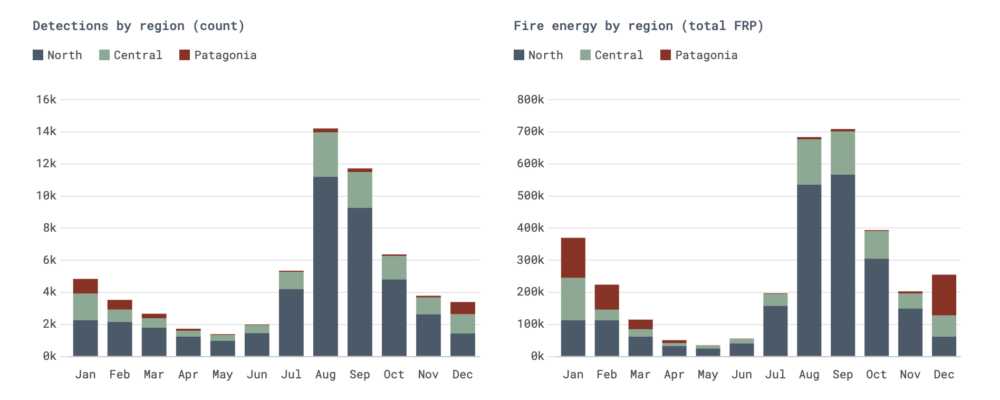
We can split the fire detection in Argentina into three distinct areas. The north (Chaco, Formosa, Corrientes) that drives 71% of detections. Central Argentina adds 23%. And lastly, Patagonia contributes just about 6%. However small the percentage Patagonia’s fires contribute is, their intensity is more than twice as high per detection.

This clearly demonstrates that if we are looking at detection count alone, we are missing the intensity and therefore the damage these fires caused.
Detection count vs fire energy tells opposite stories
Not only were we missing part of the story, as a matter of fact, the detection count chart and the fire energy chart peak in completely different months. The northern agricultural fires in August dominate the count by far. In comparison, the Patagonian forest fires in December-February dominate in intensity (energy).
The median Patagonian detection is 1.8x the intensity of a northern one. But the means diverge further (2.3x) because Patagonia’s extreme fires are what drive the total. Fire radiative power is heavily right-skewed: the big fires carry most of the energy. That skew is the point, bringing another dimension to our Argentinian fire analysis.
Patagonia: 6% of detections, but up to 46% of February’s fire energy
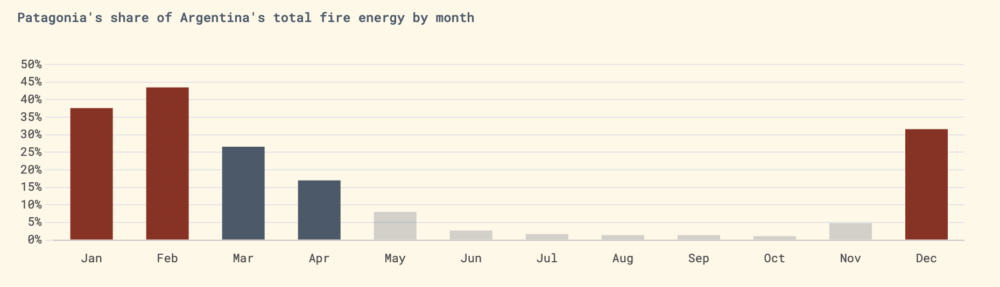
If we look closer at Patagonia, in an average February the region accounts for around 44% of Argentina’s total fire energy despite contributing a fraction of the detection count. The reason behind Patagonia’s high total fire energy are its high-altitude forest fires in national parks, mostly driven by drought, heat and wind during the austral summer. These fires not only destroy old forest, but also trigger evacuations that regularly earn feature on the international news.
It is important to say that Patagonia’s fire energy share is volatile. In years with a large fire event, the region can account for over 80% of February’s energy. In quiet years, it drops to under 2%. The average of 44% is real but driven by whether a major event happens that year or not.
Going back to the the August fire detections in the north. Those are thousands of moderate-intensity agricultural and grassland burns. High count, but lower in individual impact.
Ranking Patagonia’s fire seasons
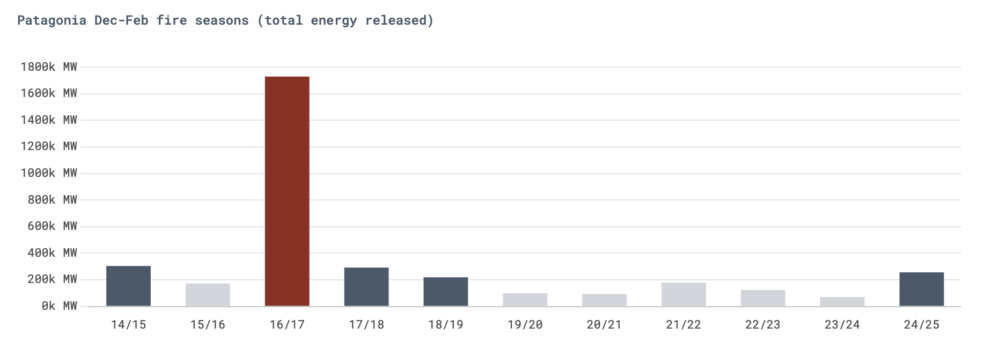
In summary, not all summers are equal in Patagonia. The 2016/2017 season was catastrophic: over 10,000 fire detections with an average intensity of 170 MW (megawatts), six times more energy than a typical season. The 2024/2025 season ranked fourth by total energy, with 2,077 detections including a single pixel reading of 4,847 MW on 1 February 2025 near Lago Rivadavia (44.1°S, 71.5°W).
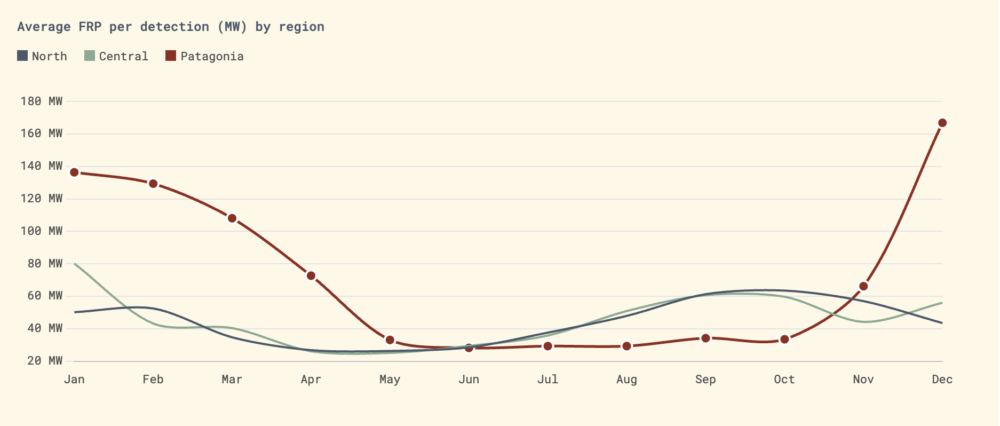
Average fire intensity by region and month
If Patagonia’s average fire intensity is so much higher, how does it compare to the rest of the regions? For that, we have to look at the average fire radiative power (FRP) per detection, split by region. Patagonian fires in December average 167 MW per detection, compared to 48 MW for northern fires in August. On high-confidence detections only (confidence 80+), the gap widens: Patagonia averages 200 MW against the north’s 119 MW.
The test case: Patagonia, January 2025
Everything from the count base analysis, to fire intensity across different months played out in a single fire season.
Between December 2024 and February 2025, fires tore through Patagonia’s national parks. As a result, Lanin National Park lost 23,844 hectares of forest coverage. Nahuel Huapi burned 12,072 hectares. On top of that, El Bolson evacuated 1,000 residents and lost over 300 homes. In Corrientes province, grassland fires consumed an area the size of Vancouver Island. At least two people died. Sixteen aircraft were deployed simultaneously, described by officials as “historic” in scale.

Our MODIS (satellite-based sensor used for earth and climate measurements) data ranks this season fourth by total energy: 2,077 Patagonian detections with 255,730 MW of cumulative fire radiative power. A bad season, but not exceptional by the numbers alone. Both of those things are true. They just expose three gaps between satellite data and ground reality:
Resolution
MODIS sees 1km pixels. A fire front 200 metres wide moving through Lanin might only trigger a detection when it’s hot enough to light up a full square kilometre. VIIRS at 375m catches more of those fronts, which is why GWIS totals (which blend both sensors) run higher. We use MODIS-only because it gives us a consistent 2015-2025 time series. VIIRS NOAA-20 only starts in 2017.
Count vs area burned
A fire that burns 23,844 hectares doesn’t produce 23,844 detections. It produces however many 1km pixels were hot enough at the moment the satellite passed overhead. A fast-moving, wind-driven fire can burn massive area while generating fewer hot-pixel snapshots than a slow-burning agricultural fire that smoulders in Chaco for days.
Energy vs damage
Our energy proxy (sum of FRP) captures radiative output at the moment of observation. It doesn’t capture what burned between satellite passes, or the ecological and human cost. A 50 MW grassland fire in Chaco and a 50 MW forest fire inside a UNESCO World Heritage site have identical FRP readings but completely different consequences.
Where the satellite data ends
This analysis began with a simple question: When do fires peak in Argentina? The answer depended entirely on what we measured. Detection counts peaked in August; fire energy peaked in January; and ground-truth impacts showed that both figures understated the damage. All three answers are correct, but none is complete. The metric you choose shapes what you see—and which insights you pursue.
Methodology and caveats
A MODIS detection is a heat signal, not a confirmed fire: it indicates brightness above a threshold in a 1 km pixel. Agricultural burns, industrial heat, and volcanic activity can all register. When new VIIRS sensors came online (NOAA-20 in 2017 and NOAA-21 in 2022), detection counts rose without any change in actual fire activity.
FRP is a better proxy for intensity, but it is still satellite-derived and not ground-truthed. FRP distributions are heavily right-skewed in all regions, so extreme events dominate total energy. We use mean FRP values and note medians where the difference matters.
Geographic zones are defined by latitude (North above 30°S, Central 30–38°S, Patagonia below 38°S), serving as rough proxies for fire-behaviour regions rather than administrative boundaries. 49% of Patagonia detections are high-confidence (80+) compared with 30% in the North, meaning Patagonia has a higher proportion of detections classified as “confirmed fire.” Patagonia’s share of total fire energy varies widely by year: in February, it ranges from 1.6% to 83.4%, depending on whether a major event occurs.
2025 ground-impact data come from the Buenos Aires Herald, The Guardian, AP News, and Argentina’s National Fire Management Service.
See how we quantify impact across thousands of Earthshot Prize nominations.